Martyn Hill recently discovered a bug in later versions of Minerva, but couldn’t quite pin it down. I thought it might be nice to write up a little tutorial about how I try to tackle these kind of problems.
The most important thing of course is being able to reproduce the problem, which was the hard part here as I haven’t had any networked QLs for 20 years. I didn’t remember any of the commands and devices used and somehow one ULA died along the way, which didn’t exactly help matters. But in the end I got it going and yeah, I could get it to crash:
QL1:
  NET 1
  SBYTES neto_2,131072,32768

QL2 (the one that will crash):
  NET 2
  LBYTES neti_1,131072
The “LBYTES” never returns here. The first thing to do in these cases is loading QMON and simply activating it
LRESPR flp1_qmon
qmon
Qmon> g
This way we will ideally break into the debugger if anything fishy happens. So, try the repro again and bingo:
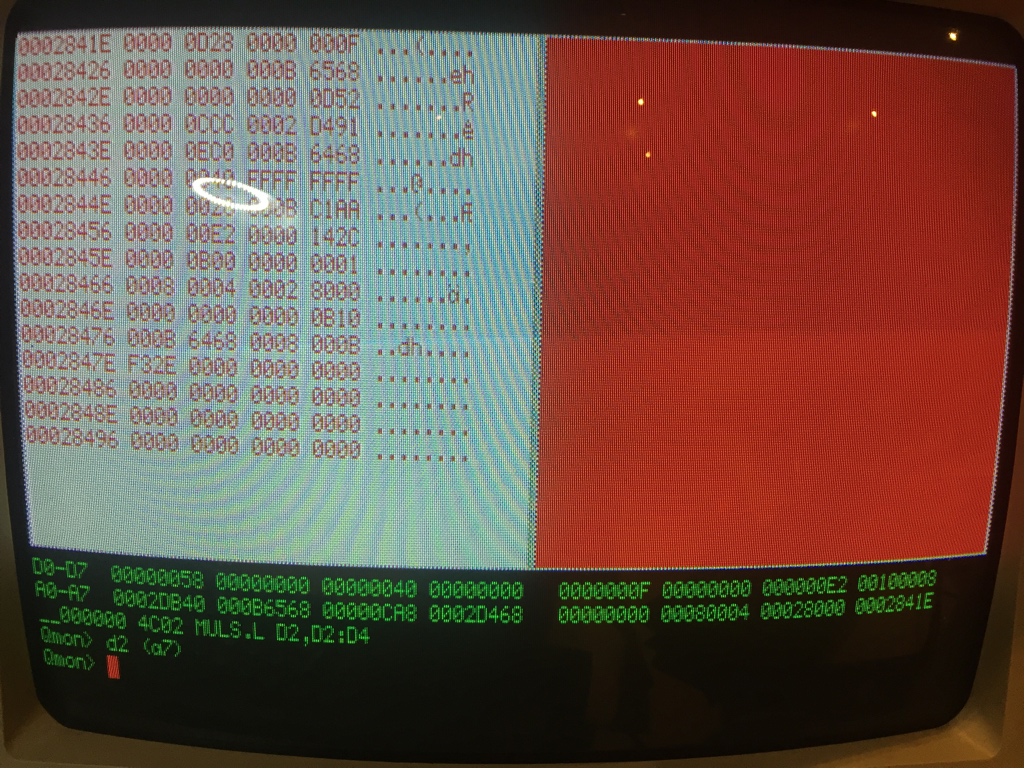
Excuse the quality, at this point I didn’t know I will be writing about this, I made the picture just in case I need any data from it later in the process! Two things will look odd for people experienced in QMON, the “__000000” and the “MULS.L”. The first prefix “__” is an extension that displays addresses relative to the job base, which makes debugging jobs so much easier. In this case the JOB is SuperBasic, which has a start address of 0, so we’re actually at the absolute address 0 here. “MULS.L” is a 68020 instruction and now I can be glad I did this on a BBQL because this way the crash happened as early as possible. I think both the job-relative and the 68020 features were added to QMON by me some 15 years ago and were probably never released, but it doesn’t matter for this exercise.
The next step is to look at the stack, hence the “d2 (a7)”. There we see “00000D28”, which could potentially be a ROM address. In this case I have assembled Minerva myself so I have the corresponding _MAP file ready, which is invaluable when debugging assembler code:
SECTION   00000C9C  00000D78                                            IO_SERIO

          00000C9C  00000D78  SRC_MINERVA_IO_SERIO
                    00000CA8    IO_SERIO
                    00000CAA    IO_RELIO
This looks legit, so we open the source file “io_serio_asm” and also have a look into DISA to check which instruction exactly is there
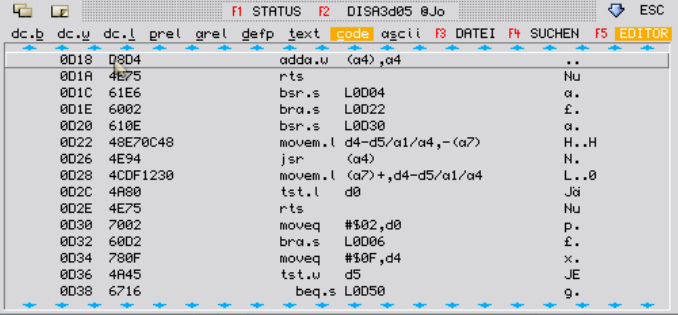 Bingo, there is a jump instruction directly in front of it, so we’re at the right place. We look for it in the source code
callit
        movem.l d4-d5/a1/a4,-(sp) save our registers
        jsr     (a4)            call the test/fetch/send routine
        movem.l (sp)+,d4-d5/a1/a4 restore our registers
tstret
        tst.l   d0              ensure set ccr before returning
        rts
It jumps to a4 and, referencing the picture above, a4 is 0. We can also see the contents of the saved registers on the stack “0000000F” for D4, “00000000” for d5, “000b6568” for a1 and again “00000000” for a4. The next long word is “00000d52” which again looks like an address, so where are we coming from? Again, looking it up in DISA and then searching the instruction sequence in the source we end up at the label “headr1”
headr1
        bsr.s   io_pend         see if there is a byte available yet
        bne.s   setd1           if not, or there's a problem, return updated
        not.b   d1              check the value of the waiting byte
        bne.s   err_bp          error if it isn't $ff
Ah, so we were calling io_pend, let’s look at this code
io_pend
*        moveq   #0,d0           test routine is the first element
        bsr.s   vectest         set up test routine address
        bra.s   callit          go do it
Lau commented out the “moveq” because he thinks d0 is 0 here anyway. We have a look at “vectest”
vectest
        exg     a4,d0
        btst    #0,d0           test lsb of address register
        exg     a4,d0
        beq.s   vecrel          if zero, go do relative vector
        move.l  -1(a4,d0.w),a4  pick up serio's absolute vector
        rts
vecrel
        add.w   (a4),a4         add relio's relative vector to get absolute
        rts
where we see that D0 is used as an index but should be the same going out as going into the function. No we have a look at the QMON screenshot and see that D0 is actually “00000058”! So the assumption that it would be “0” doesn’t hold and this explains our crash. We include the “moveq” in the source code, reassemble and burn the EPROM and yes, it doesn’t crash anymore. Happy days 🙂
The whole process maybe took 10 minutes, it was actually a pretty straight forward. For sure it took a lot longer to write it up 😉 I know Martin has been working at this for quite a bit, so I thought I’d share my method in the hopes that more people can find and fix these kind of bugs in the future.
For everybody who is not at home assembling Minerva I have added an English and German version with the fix here:
Dear Marcel, what can I say, except thank you!
Your approach is SO much more efficient than what I was attempting 🙂
Nice write up Marcel, thanks. (My spell checker calls you Marvel – it’s not wrong!)
Cheers,
Norm.